This is an explanation of how I created an automatic dial reader with Matlab and a webcam.
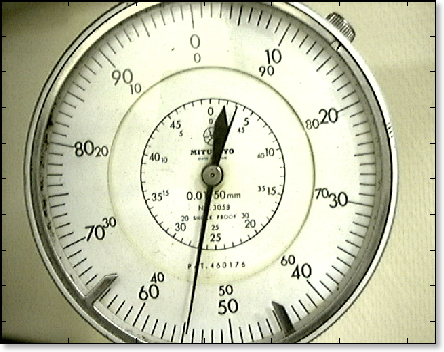
First I took a picture of the dial indicator.

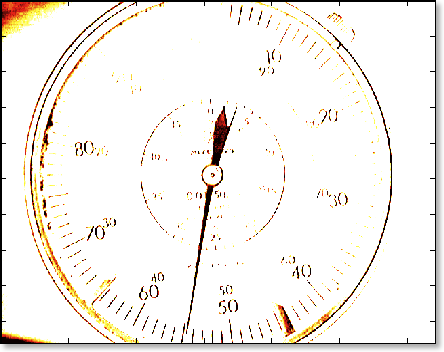
Then I converted it to a single color. (This is necessary for the contour extraction).

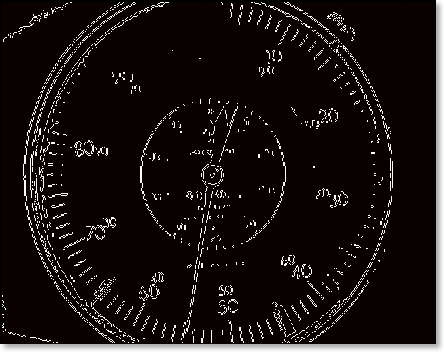
After that, I extracted the contours. There are a fair number of contour extraction methods, but I used the Matlab default: Sobel. It seemed to have the best performance for my needs. I wanted it to extract only the most important information, i.e. the longest lines.

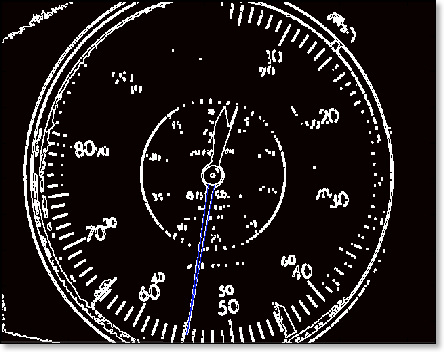
After that, I thickened the image in order to increase the weight of the lines, and thus increase the significance of the two long lines that form the edge of the need

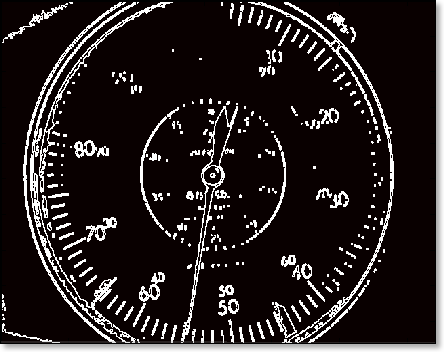
Finally, I performed a Hough transform on the image, filtering all but the longest two lines. These two remaining lines were (usually) the left- and right-hand side of the needle. Where the lines intersect is where the needle points.

This is the Matlab code. Notice, I used the Hough algorithm from Matlab. This is only available on Matlab 7 SP2 and later. If you do not have this, you can use this Hough transformation code (although it's not quite as nice) or download a free image analysis toolbox.
function m=dial_reader(Image,lightThresh)
%hough_analysis performs a hough transformation on each image in a movie
%file. The two longest lines are then stored in (x1,y1) and (x2,y2)
%coordinate fashion in cal_lines.
global circle rectCrop BandWect
thickener = strel('square',4);
cropImage=imcrop(Image,rectCrop);
% BandW=uint8(im2bw(Image,lightThresh-0.05));
BandW=uint8(im2bw(cropImage,lightThresh-0.05));
[BandWe,thresh]=edge(BandW,'sobel');
BandWec=BandWe.*imcrop(circle,rectCrop);
% BandWec=BandWe.*circle;
BandWect=imdilate(BandWec,thickener);
% image(BandW);
% drawnow
imagesc(BandWect);
colormap(jet)
drawnow
[TransH,theta,rho]=hough(BandWect);
peaksH=houghpeaks(TransH,2,'Threshold',0.3);
linesH=houghlines(BandWect, theta, rho, peaksH,'MinLength',150,'Fillgap',20);
if length(linesH) < 2 %If we've only found one line for some reason or another.
% m=0
else
[u1,v1]=linesH.point1;
[u2,v2]=linesH.point2;
cal_lines(1:4, 1)=[[u1(1) u2(1)] [u1(2) u2(2)]];
cal_lines(1:4, 2)=[[v1(1) v2(1)] [v1(2) v2(2)]];
v=cal_lines(1:4,1);
w=cal_lines(1:4,2);
a1 = v(4) - v(3);
b1 = v(1) - v(2);
c1 = v(1)*v(4) - v(2)*v(3);
a2 = w(4) - w(3);
b2 = w(1) - w(2);
c2 = w(1)*w(4) - w(2)*w(3);
if (-a1*b2+b1*a2)==0
m=1/0;
%Does nothing. This triggers an error and a catch in the calling
%loop.
else
x1 = (-b2*c1+c2*b1)/(-a1*b2+b1*a2);
y1 = (-a1*c2+c1*a2)/(-a1*b2+b1*a2);
m=[x1 y1];
% line(cal_lines(1:2,1),cal_lines(3:4,1),'Color',[0 0 1]) %Blue line
% line(cal_lines(1:2,2),cal_lines(3:4,2),'Color',[1 0 0]) %Red line
hold on;
for k = 1:length(linesH)
xy = [linesH(k).point1; linesH(k).point2];
plot(xy(:,1),xy(:,2),'LineWidth',2,'Color','magenta');
% Plot beginnings and ends of lines
plot(xy(1,1),xy(1,2),'x','LineWidth',2,'Color','yellow');
plot(xy(2,1),xy(2,2),'x','LineWidth',2,'Color','red');
end
plot(x1,y1,'g-x');
hold off;
end
drawnow
end
save calibration_transforms.mat cal_lines rates