A-D converter the hard (but cheap!) way
Usually, when you have to measure something and input the data into the computer, you buy a digital meter. But what do you do when you already have an old, trusty analog meter and don’t want to shell out for a new digital meter?
You could just take the measurements by hand and write them all into the computer. But what do you do if you need thousands and thousands of measurements? Multiple times?
Math and image analysis to the rescue!
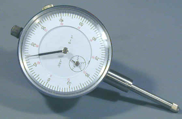 I had a few situations where I had to measure the displacement and/or depth of a work-piece. I had an old dial indicator on hand, and a webcam. My solution was to grab the data with Matlab, and apply a Hough transform to it. With my latest algorithm (and good lighting), I got a 99% accuracy over 2000 photos.
1st, capture your photo:
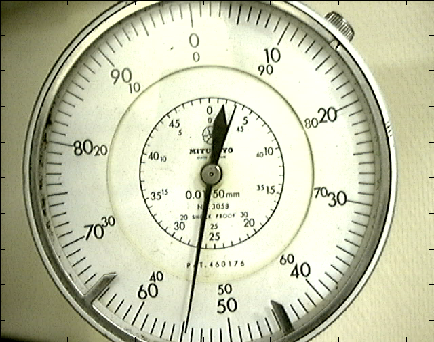
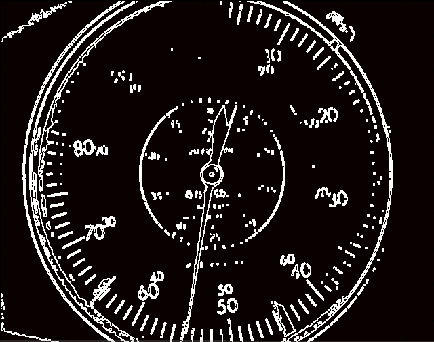
Second, reduce it to just one color:
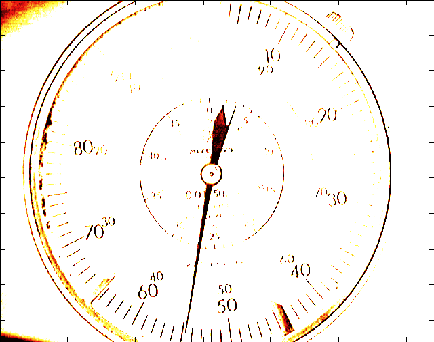
Third, perform an edge extraction:
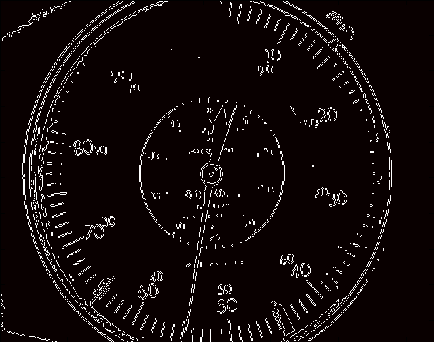
Fourth, I thicken the lines a little so it’s easier to find the needle:
Fifth, apply the Hough transform to locate the longest continuous lines in the image:
Once you have the lines, the rest is simple. Draw a line from the center of the dial indicator to the intersection of the two lines, take the arc distance from the dial’s 0 to this new line, and scale it to match your units. Presto! Instant digital input.
On my centrino, it analyzes 320x240 images at a rate of about 4/s.
You can write your own code, but I’ve included my old matlab code. Note, my code is just a little different from when I originally made these images. I improved it when working on another dial indicator.
Also, it helps to have good lighting. It helps A LOT. Be sure that there is strong, but diffuse, lighting on the dial face. Fluorescent lights and diffuse sunlight are the best for this. A bright halogen lamp that’s reflecting off a ceiling or wall can give good results, too. Basically, you don’t want to see a reflection in the meter’s glass.
This comes in two files. The first is dial_indicator.m, and is the main script. The second is dial_reader.m, which is the function that actually does all the heavy lifting, taking an image as an argument and returning the cartesean coordinates of the tip of the needle.
%Dial Indicator, analog to digital
%===============================
clear measure
NumPictures= length(mov0(1,:))
figure(1)
image(mov0(1,1).cdata);
uiwait(warndlg('Indicate the center of the dial.'));
[x0,y0] = ginput(1);
uiwait(warndlg('Indicate the 0 mark.'));
[x00,y00] = ginput(1);
[theta0,rho] = cart2pol(x00-x0,y00-y0)
%Background generator
%=================================
sum=0;
count=0;
NumPictures= length(mov0(1,:))
% NumPictures=50
for i=1:floor(NumPictures/20):NumPictures
sum=sum+double(mov0(1,i).cdata);
count=count+1
image(uint8(sum/count))
drawnow
end
background=uint8(sum/count);
figure(2)
figure(1)
revolutions=0;
Image=mov0(1,i).cdata;
CartM=dial_reader(background-Image);
theta=cart2pol(CartM(1)-x0,CartM(2)-y0);
measure(i)=mod((theta-theta0)*100/(2*pi),100)
[uint8(i) measure(i)]
for i=2:NumPictures
% try
Image=mov0(1,i).cdata;
CartM=dial_reader(background-Image);
theta=cart2pol(CartM(1)-x0,CartM(2)-y0);
measure(i)=mod((theta-theta0)*100/(2*pi),100)+revolutions*100;
if measure(i-1)-measure(i) > 80
revolutions=revolutions+1;
measure(i)=measure(i)+100;
elseif measure(i-1)-measure(i) < -80
revolutions=revolutions-1;
measure(i)=measure(i)-100;
end
[uint8(i) measure(i)]
% end
end
function m=dial_reader(Image)
%hough_analysis performs a hough transformation on each image in a movie
%file. The two longest lines are then stored in (x1,y1) and (x2,y2)
%coordinate fashion in cal_lines.
global circle
% mov=aviread('/Users/kubark/Desktop/Export.avi')
% start=1800;
% duree=max(size(mov));
% colormap(hot);
% cal_lines=zeros(duree,5,2);
% j=0;
thickener = strel('line',2,0);
thickener = strel('square',4);
% BandW=rgb2gray(Image);
% BandW(BandW>40)=255;
BandW=uint8(im2bw(Image,.25));
[BandWe,thresh]=edge(BandW,'sobel');
BandWec=BandWe;%.*circle;
BandWect=imdilate(BandWec,thickener);
% BandWect=BandWec;
imagesc(BandWect);
[TransH,theta,rho]=hough(BandWect);
peaksH=houghpeaks(TransH,4,'Threshold',0.3);
linesH=houghlines(BandWect, theta, rho, peaksH,'MinLength',40,'Fillgap',15);
if length(linesH) < 2 %If we've only found one line for some reason or another.
m=0;
else
[u1,v1]=linesH.point1;
[u2,v2]=linesH.point2;
cal_lines(1:4, 1)=[[u1(1) u2(1)] [u1(2) u2(2)]];
cal_lines(1:4, 2)=[[v1(1) v2(1)] [v1(2) v2(2)]];
line(cal_lines(1:2,1),cal_lines(3:4,1),'Color',[0 0 1]) %Blue line
line(cal_lines(1:2,2),cal_lines(3:4,2),'Color',[1 0 0]) %Red line
v=cal_lines(1:4,1);
w=cal_lines(1:4,2);
a1 = v(4) - v(3);
b1 = v(1) - v(2);
c1 = v(1)*v(4) - v(2)*v(3);
a2 = w(4) - w(3);
b2 = w(1) - w(2);
c2 = w(1)*w(4) - w(2)*w(3);
if (-a1*b2+b1*a2)==0
i
else
x1 = (-b2*c1+c2*b1)/(-a1*b2+b1*a2);
y1 = (-a1*c2+c1*a2)/(-a1*b2+b1*a2);
hold
plot(x1,y1,'g-x')
hold
m=[x1 y1];
end
drawnow
end
%===================================================
dial_reader.m, a function that takes an image as its argument and returns the cartesean coordinates of the tip of the needle. When it runs, it draws the transformed image so that you can verify that the lighting conditions, etc., are good enough for the image transformations.
function m=dial_reader(Image)
%hough_analysis performs a hough transformation on each image in a movie
%file. The two longest lines are then stored in (x1,y1) and (x2,y2)
%coordinate fashion in cal_lines.
global circle
% mov=aviread('/Users/kubark/Desktop/Export.avi')
% start=1800;
% duree=max(size(mov));
% colormap(hot);
% cal_lines=zeros(duree,5,2);
% j=0;
thickener = strel('line',2,0);
thickener = strel('square',4);
% BandW=rgb2gray(Image);
% BandW(BandW>40)=255;
BandW=uint8(im2bw(Image,.25));
[BandWe,thresh]=edge(BandW,'sobel');
BandWec=BandWe;%.*circle;
BandWect=imdilate(BandWec,thickener);
% BandWect=BandWec;
imagesc(BandWect);
[TransH,theta,rho]=hough(BandWect);
peaksH=houghpeaks(TransH,4,'Threshold',0.3);
linesH=houghlines(BandWect, theta, rho, peaksH,'MinLength',40,'Fillgap',15);
if length(linesH) < 2 %If we've only found one line for some reason or another.
m=0;
else
[u1,v1]=linesH.point1;
[u2,v2]=linesH.point2;
cal_lines(1:4, 1)=[[u1(1) u2(1)] [u1(2) u2(2)]];
cal_lines(1:4, 2)=[[v1(1) v2(1)] [v1(2) v2(2)]];
line(cal_lines(1:2,1),cal_lines(3:4,1),'Color',[0 0 1]) %Blue line
line(cal_lines(1:2,2),cal_lines(3:4,2),'Color',[1 0 0]) %Red line
v=cal_lines(1:4,1);
w=cal_lines(1:4,2);
a1 = v(4) - v(3);
b1 = v(1) - v(2);
c1 = v(1)*v(4) - v(2)*v(3);
a2 = w(4) - w(3);
b2 = w(1) - w(2);
c2 = w(1)*w(4) - w(2)*w(3);
if (-a1*b2+b1*a2)==0
i
else
x1 = (-b2*c1+c2*b1)/(-a1*b2+b1*a2);
y1 = (-a1*c2+c1*a2)/(-a1*b2+b1*a2);
hold
plot(x1,y1,'g-x')
hold
m=[x1 y1];
end
drawnow
end
by Kenn Sebesta. This script was developed during my Masters degree in Controls and Robotics at the Université de Bourgogne in Dijon, France. You can read about the entire Ball and Plate project if you want to.